


Executive Overview
Companies are bracing themselves for rising healthcare costs in 2027 and are facing a deluge of pessimistic projections for double-digit increases: an 8% to 11% jump that will push average cost per employee from roughly $19,600 today to somewhere between $21,200 and $21,700 in 2027 (our own modeled estimate, detailed in the chart notes below). The Wall Street Journal calls it “the biggest health-insurance increase in at least two decades,” and the New York Times reports that more than a third of employers surveyed by Marsh expect their costs to rise by at least 10% even after they cut benefits.
For many companies, healthcare is already the second or third largest controllable operating expense after payroll.1 For a 1,000-employee self-funded2 company, another 10% on top of that means roughly $2 million of incremental cost in a single year: a P&L hit that would be scrutinized line-by-line if it appeared anywhere else in the budget. Yet if asked about the composition of their healthcare costs and what specific actions they are taking to address this increase, most CEOs and CFOs will not have good answers.
According to Marsh’s 2026 National Survey of Employer-Sponsored Health Plans (Mercer’s health and benefits consulting business, now rebranded as Marsh), about two-thirds of large employers plan to increase employees’ share of premium costs in 2027, and 59% are making other cost-cutting plan changes such as higher deductibles, increased co-pays, and narrowed provider options. Aon’s latest forecast puts the average employee’s total healthcare bill (payroll deductions plus out-of-pocket) at nearly $5,300 in 2026, up 7.9% in a single year and the largest increase in a decade, with 2027 expected to be worse. The result is a significant erosion of employees’ take-home pay and turning healthcare into a live issue for the board, HR, and the CEO, not just a line item the CFO signs off on once a year.
Why Is Self-Funded Healthcare Spending Difficult to Track?
This problem comes from a lack of visibility and transparency. HR sees what benefits the employees get, and what medical expenses the company covers. Finance sees monthly costs that arrive as a complicated amalgam of information from different sources in different formats. CFOs have not been trained during their careers to understand and examine healthcare costs. This has traditionally been an issue for HR and the benefits team. No one, by default, sees the whole picture.
Where the Money Actually Goes
Before an employer can lower healthcare costs, leadership must understand what it is already paying for. Every dollar a self-funded employer spends on healthcare falls into one of three buckets.3
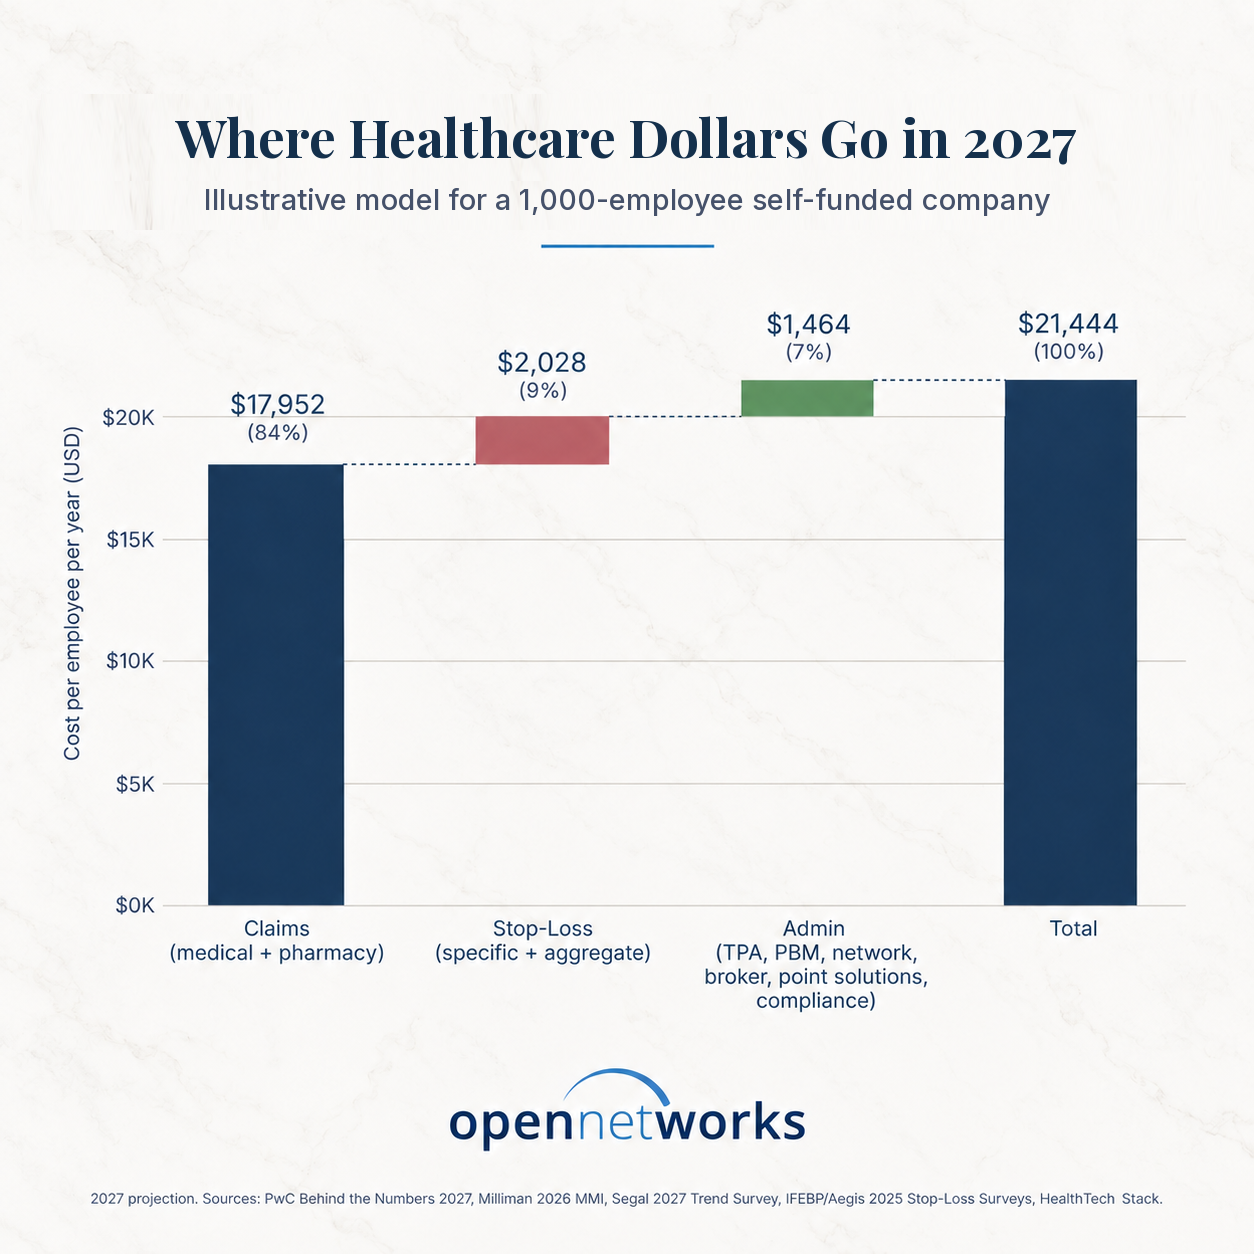
Bucket 1: Healthcare Costs (The Claims). The money that pays for care the employees and their families actually receive. This covers hospital stays, surgeries, doctor visits, emergency rooms, imaging, physical therapy, home health, ambulance rides, medical equipment, and every prescription filled at the pharmacy counter. This is the largest bucket by far, and it is what every company and every CFO needs to understand and where they should focus their efforts to control costs.
Bucket 2: Stop-Loss Insurance. Because a self-funded employer is responsible to pay claims, two things can blow up an annual budget: a single catastrophic case (a premature birth, a transplant, a course of specialty drugs) or a year where total claims simply run hotter than expected across the whole population. Stop-loss insurance is the risk transfer that caps both exposures. Industry data show stop-loss premiums grew by nearly 13% in the most recent renewal cycle, driven by a surge in million-dollar specific claims and an explosion of specialty drug and gene therapy costs4. Stop-loss is now the single fastest-growing healthcare cost line.
Bucket 3: Administrative Costs. This covers everything else it takes to administer the healthcare plan: paying the claims, the network that negotiates the discounts with providers, the pharmacy benefit manager that runs the drug plan, the broker or consultant who defined the plan, the regulatory compliance work, etc.
Companies often focus on the administrative fees, not on the costs that these service providers drive. It is like hiring the lowest-cost general contractor for a project, only to watch them turn around and hire the most expensive subcontractors and buy the most expensive materials, which they do because they have an economic incentive to drive up your costs. There’s an old expression, “stepping over dollars to pick up pennies” and that is exactly what this is: ignoring $19,980 of claims and stop-loss costs to chase savings in $1,464 of admin costs. Future posts will go deeper on each cost bucket: what drives it, who profits from it, and where the leverage points are.
The Million-Dollar Question…Literally
In 2027, healthcare will consume more of corporate P&Ls across the U.S. than in any year on record, and the vast majority of that spend is determined via decisions leadership does not currently see. The math is unforgiving: a 5% increase in healthcare costs PEPM (Per Employee Per Month) for a 1,000-employee company represents over a million dollars in incremental cost: a level of risk that belongs in front of the Board of Directors, not buried in a benefits renewal memo.
Neal Kaufman is the CFO of OpenNetworks Health.
Notes
-
Mercer’s 2025 National Survey of Employer-Sponsored Health Plans projects average total health benefit cost per employee will exceed $18,500 in 2026 (Mercer). CMS reports that private businesses spent $967.4 billion on healthcare in 2024 (CMS National Health Expenditures 2024 Highlights), and industry analysts consistently rank healthcare as the second-largest controllable operating expense for most U.S. employers after payroll (CFO Leadership Council).
-
A self-funded (or self-insured) employer pays employees’ medical and pharmacy claims directly out of company funds rather than paying fixed premiums to an insurance carrier, typically using a third-party administrator to process claims and stop-loss insurance to cap catastrophic exposure. Self-funding is the dominant model for large U.S. employers: per the KFF 2024 Employer Health Benefits Survey, 63% of covered workers are in self-funded plans, including 82% at large firms (200+ workers) and 79% at firms of 1,000–4,999 workers. That translates to roughly 100 million U.S. workers and their dependents receiving healthcare through self-funded employer plans.
-
Chart methodology. Illustrative model for a 1,000-employee self-funded company in 2027, employer pays 100% of premium, 1.8 covered lives per enrolled employee. Each bucket is built from published 2026 PEPM (Per Employee Per Month) baselines trended forward using the primary 2027 projections cited below.
- Claims: $17,952/EE/year ($1,496 PEPM × 12). 2026 medical baseline of $1,050 PEPM (Per Employee Per Month) from the Milliman 2026 Medical Index, trended +9.0% per PwC Behind the Numbers 2027 group medical trend, to $1,145 PEPM. Pharmacy claims net of rebates of $315 PEPM (Milliman 2026 MMI) trended +11.5% per the Segal 2027 Health Plan Cost Trend Survey Rx projection, to $351 PEPM.
- Stop-loss insurance: $2,028/EE/year ($169 PEPM × 12). 2026 baseline of $150 PEPM (mid-point at a $100K specific deductible from the IFEBP 2025 Stop-Loss Survey and Aegis Risk 2025 Stop-Loss Survey) trended +12.7% per Segal’s 2026 medical stop-loss dataset (average increase at similar benefit levels).
- Admin: $1,464/EE/year ($122 PEPM × 12). 2026 stack of $118 PEPM (TPA/ASO $35, network access $18, PBM admin $8, care/utilization mgmt $10, broker/consultant $20, point solutions $25, PCORI $0.58, ACA reporting/COBRA/compliance $2), sourced from the HealthTech Stack fee analysis and the IRS 2026 PCORI rate, trended +3% for 2027 (no published 2027 admin trend; historical administrative-fee inflation runs materially below medical trend).
Total 2027 modeled cost: $21,444/EE/year, within the $21,200–$21,700 range cited in the opening paragraph.
-
Segal’s 2026 medical stop-loss dataset (225 health plans) reports that among groups maintaining similar specific stop-loss benefit levels year-over-year, average premiums rose 12.7%, up from 9.7% the prior year. Across all groups (including those that raised deductibles or aggregated specific stop-loss to blunt the increase), the average was still 11.5%, up from 7.3% (Segal, “Medical Stop-Loss Premiums Increase Nearly 13%,” June 2026).